| I have taken Storm's wood density and specific gravity data from his article,
A Friction Fire Inquiry: Hand Drill and
graphed it in Excel, after some manipulation. Below is the resultant 3-D and flat graphs. I made
some simple assumptions and changes:
- I assumed that density is a good proxy for hardness and that all plants of similar
density behaved similarly. This will allow me to take averages across plant types base only
on the density number.
- I changed he numbers to 5 being easiest and 0 being never make fire.
- I assumed that if you did the tests with a very hard spindle on a very hard fire board
that there would be no fires.
- I also assumed that for very soft fire boards and spindles there would be no fire.
- I then grouped the data into increments of density. Averaging all the densities between
.2 and .24999 into a number that represented the average density of the data you had, then
from 0.25-0.299999, etc.
- I then created the intermediate data by having the excel spreadsheet iterate filling in
other fireboards and spindles with data that represents the average of the cells above,
below, left and right of the given cell. This would iterate repeatedly until it came to a
stable answer.
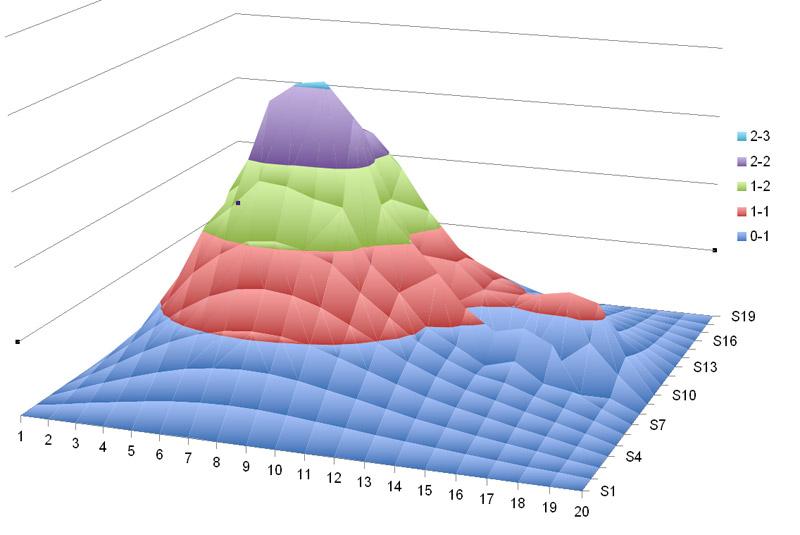
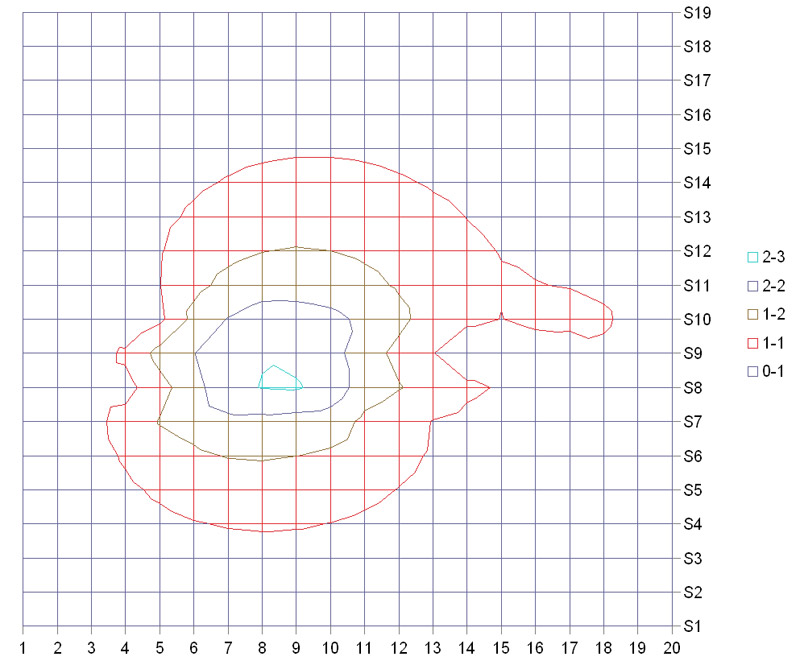
I then graphed this data on a 3D graph. You see a very prominent peak at about a density of
0.38 for fireboard and spindle. but there is another peak at fireboard 0.53 and spindle 0.821.
The first row of the dataset is the fireboard average density for the groupings The first
column of the dataset is the spindle average density of the groupings. [Webmaster's Note #1:
Storms's data assume that the samples
tested of each material are of uniform density. In actuality this is probably not the reality. For example, horseweed and
mullein have pithy cores. The critical properties of these when used as a handdrill lie in the hard outer shell, not in
the pithy core. Storm admitted that his data were somewhat flawed because of this, but he had by then moved on to other
investigations. This data is still presented here as an exploration of a concept. Plus those
materials that are of uniform density will have probably given correct results.] |